|
In This Series:
Preamble
(download .pdf)
Our Intent
(download .pdf)
How Can We Do It?
(download .pdf)
What Do We Expect From Our Selection Criteria?
(download .pdf)
Will We Find Any Significant Trend?
(download .pdf)
What's Under The Hood?
(download .pdf)
Which Stations Are We Sampling?
(download .pdf)

Click the image above to order the Junkman's:
Junk Science Judo: Self-defense Against Health Scares and Scams.
Quick Links
Top Ten 'Most Embarrassing Moments' of 2004!
Junk science?
Junkman?
Short Course
Feedback
E-mail List
Archives & Links
Reading List
Fifth Anniversary
Contact JunkScience.com:
Steve Milloy
(Publisher) or
Barry Hearn
(Editor)
CSRwatch.com / SRIwatch.com

Support JunkScience.com
Shop Amazon.com
Consumer Distorts
DDT FAQ
Malaria Clock
Dioxin in Ben & Jerry's
Capitol Radiation
Our Swollen Future
Ozone 'Depletion'
GreenSpin
NumberWatch
Living Issues
Canada Free Press
|
Estimating the Global Mean Temperature
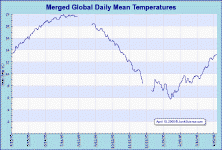
Update April 15, 2006: Merged results from Hector and Astyanax, son of Hector posted covering the first year of operation - see below. End update.
Changes to the 'Global Thermometer'
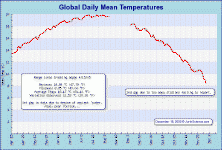
As a great many readers have noted, our near-real-time 'Global Thermometer' has not been updating since December 5. Click here to see the explanation. UPDATE: Our beta trial version of the 'global thermometer' v0.1.05, going by the affectionate appellation of 'Hector', is retiring with 2005. With the arrival of 2006 comes our new and hopefully improved (certainly more robust) son of Hector, sporting the dashing handle of GTv1.0.1 (actually a re-branding of beta 0.3.02 - but don't tell anyone). As more data is collected more graphics will return.
The significant change in GTv1.0.1 is the ability to work around the failure of quite large numbers of station reports. Son of Hector does this by using PEAR Services_Weather to query local databases to derive lists of alternate sites, that have previously been validated, in ascending order of distance from the station from which a temperature could not be retrieved and using the average of the first four available reports as a proxy for the missing data. There are two obvious consequences of this workaround: firstly, although we check that candidate surrogates are in our validated database and only request temperatures from known reporters the number of stations currently unavailable means that we have reluctantly more than doubled the number of data requests made against NOAA's METAR servers. To prevent GTv1.0.1 becoming a nuisance the total number of requests that may be made is arbitrarily limited to five thousand in any one hour or the cycle is aborted and no temperature is recorded. Secondly, although of greater import to those with a burning interest in deriving the most accurate land-based near-surface temperature available, the simple fact that people basically live in the warmer regions of the globe means that the majority of surrogate temperatures are derived from locations nearer the equator than those they are meant to replace. Because most landmass is in the northern hemisphere this will tend to suppress the reduction in global mean (land-based) near-surface temperatures
during the northern winter. Conversely, if there is still a problem retrieving our selected optimal set during the northern summer, we anticipate there will not be the same peak observed by Hector - we'll just have to wait and see, won't we.
Preamble:
Jump straight to graphics
Comparing results with National Climatic Data Center's global record
One of the questions most frequently received here at JunkScience.com is “What is the current global mean temperature?” Certainly a reasonable question given the attention currently paid to Anthropogenic Global Warming (AGW) and one for which you could reasonably expect a good answer. Unfortunately, expectation and reality are far removed.
The absolute global mean surface air temperature is an elusive figure and we should briefly examine why this is so.
Before we can attempt to determine an absolute temperature we need to understand and specifically define that which we seek. So, when we talk about ‘near-surface’ temperatures or even the ‘absolute surface air temperature,’ how exactly are we defining and measuring that? Do we mean the temperature of the air in contact with the Earth’s surface? Perhaps it’s the temperature 1, 2, 5 or even 50 metres from the surface? Or maybe it’s the average of readings every n metres over a given height from some arbitrary ‘absolute surface’? We are not aware of any ISO standard for such a measure nor any agreed method so we are already faced with arbitrary decisions which may not be comparable with any other metrics ‘in captivity,’ as they say. Obviously, there are many decisions to be made on sampling method, frequency etc. and we will lay out our chosen methodology, or rather, the method we were essentially forced to adopt, in a subsequent section.
With moderate confidence we assert there is no ‘magical’ point in the Earth’s atmosphere where we might conveniently locate a thermometer and take the planet’s temperature (thank you, several people have already offered their opinions on metaphorical orifices but we really are interested in the global mean temperature). We’ll just have to make do with rather more complex and likely less satisfactory measures. While we attempt to derive this wondrous figure we might also ponder some benchmark against which we shall compare our measure that we shall know whether our maternal nurture-figure ‘Mother Earth’ is fevered or chilled. What is the ‘correct’ temperature for the planet? Is it the low end of the scale, where Earth has lingered for so many of the last few hundred millennia? Is it to be found in the comparatively warmer climes of interglacial periods, where the biosphere has thrived and human societies prospered? We cannot tell you what is the ‘right’ number or even trend but there are no prizes for guessing our preferred end of the scale.
We need to understand also that the atmosphere is not static but volatile and highly dynamic. We lack the capacity to capture simultaneous ‘single state’ measures around the globe and throughout the atmosphere and we must realise that Omar Khayyam’s words apply particularly well to atmospheric temperature – rather
than: “The moving finger writes, and having written moves on. Nor all thy piety nor all thy wit, can cancel half a line of it” we should consider the convections and thermals constantly churning our atmosphere – having sampled free air temperature, will it ever be the same again or is it like trying to “step in the same river twice”?
Hopeless task? Perhaps it is but whether our numbers are any worse than anyone else’s you’ll have to work out from our methodology and results. (This text is available as .pdf)
|| Next >>
What we learned from 'Hector':

Merged results from Hector and Astyanax, son of Hector:
A year has passed since we initiated this project and it certainly seems to have held a great many readers' interest. Despite a few little dramas, like the failure of the initial host machine and a subsequent surprise as a number of stations abruptly stopped reporting, we have managed to capture a few interesting events. Astyanax, our updated progeny version software and hence son of Hector, has proven quite robust in the face of somewhat erratic data availability and captured the interesting gyrations of mean temperature as alternating polar breakouts and warm interludes gave weather forecasters much to mention. As initially predicted, northern hemisphere seasons are the predominant feature. It will be interesting to see whether Astyanax remains more sensitive to minor perturbation, whether the colder, northern hemisphere winter is generally given to more abrupt fluctuation or if a longer record will tend to smooth its oscillations. One year down and, so far, so good.

Merged Result
Updated Daily
|
Last Week's Track
Updated Weekly
|
|| Next >>
JunkScience.com
|

